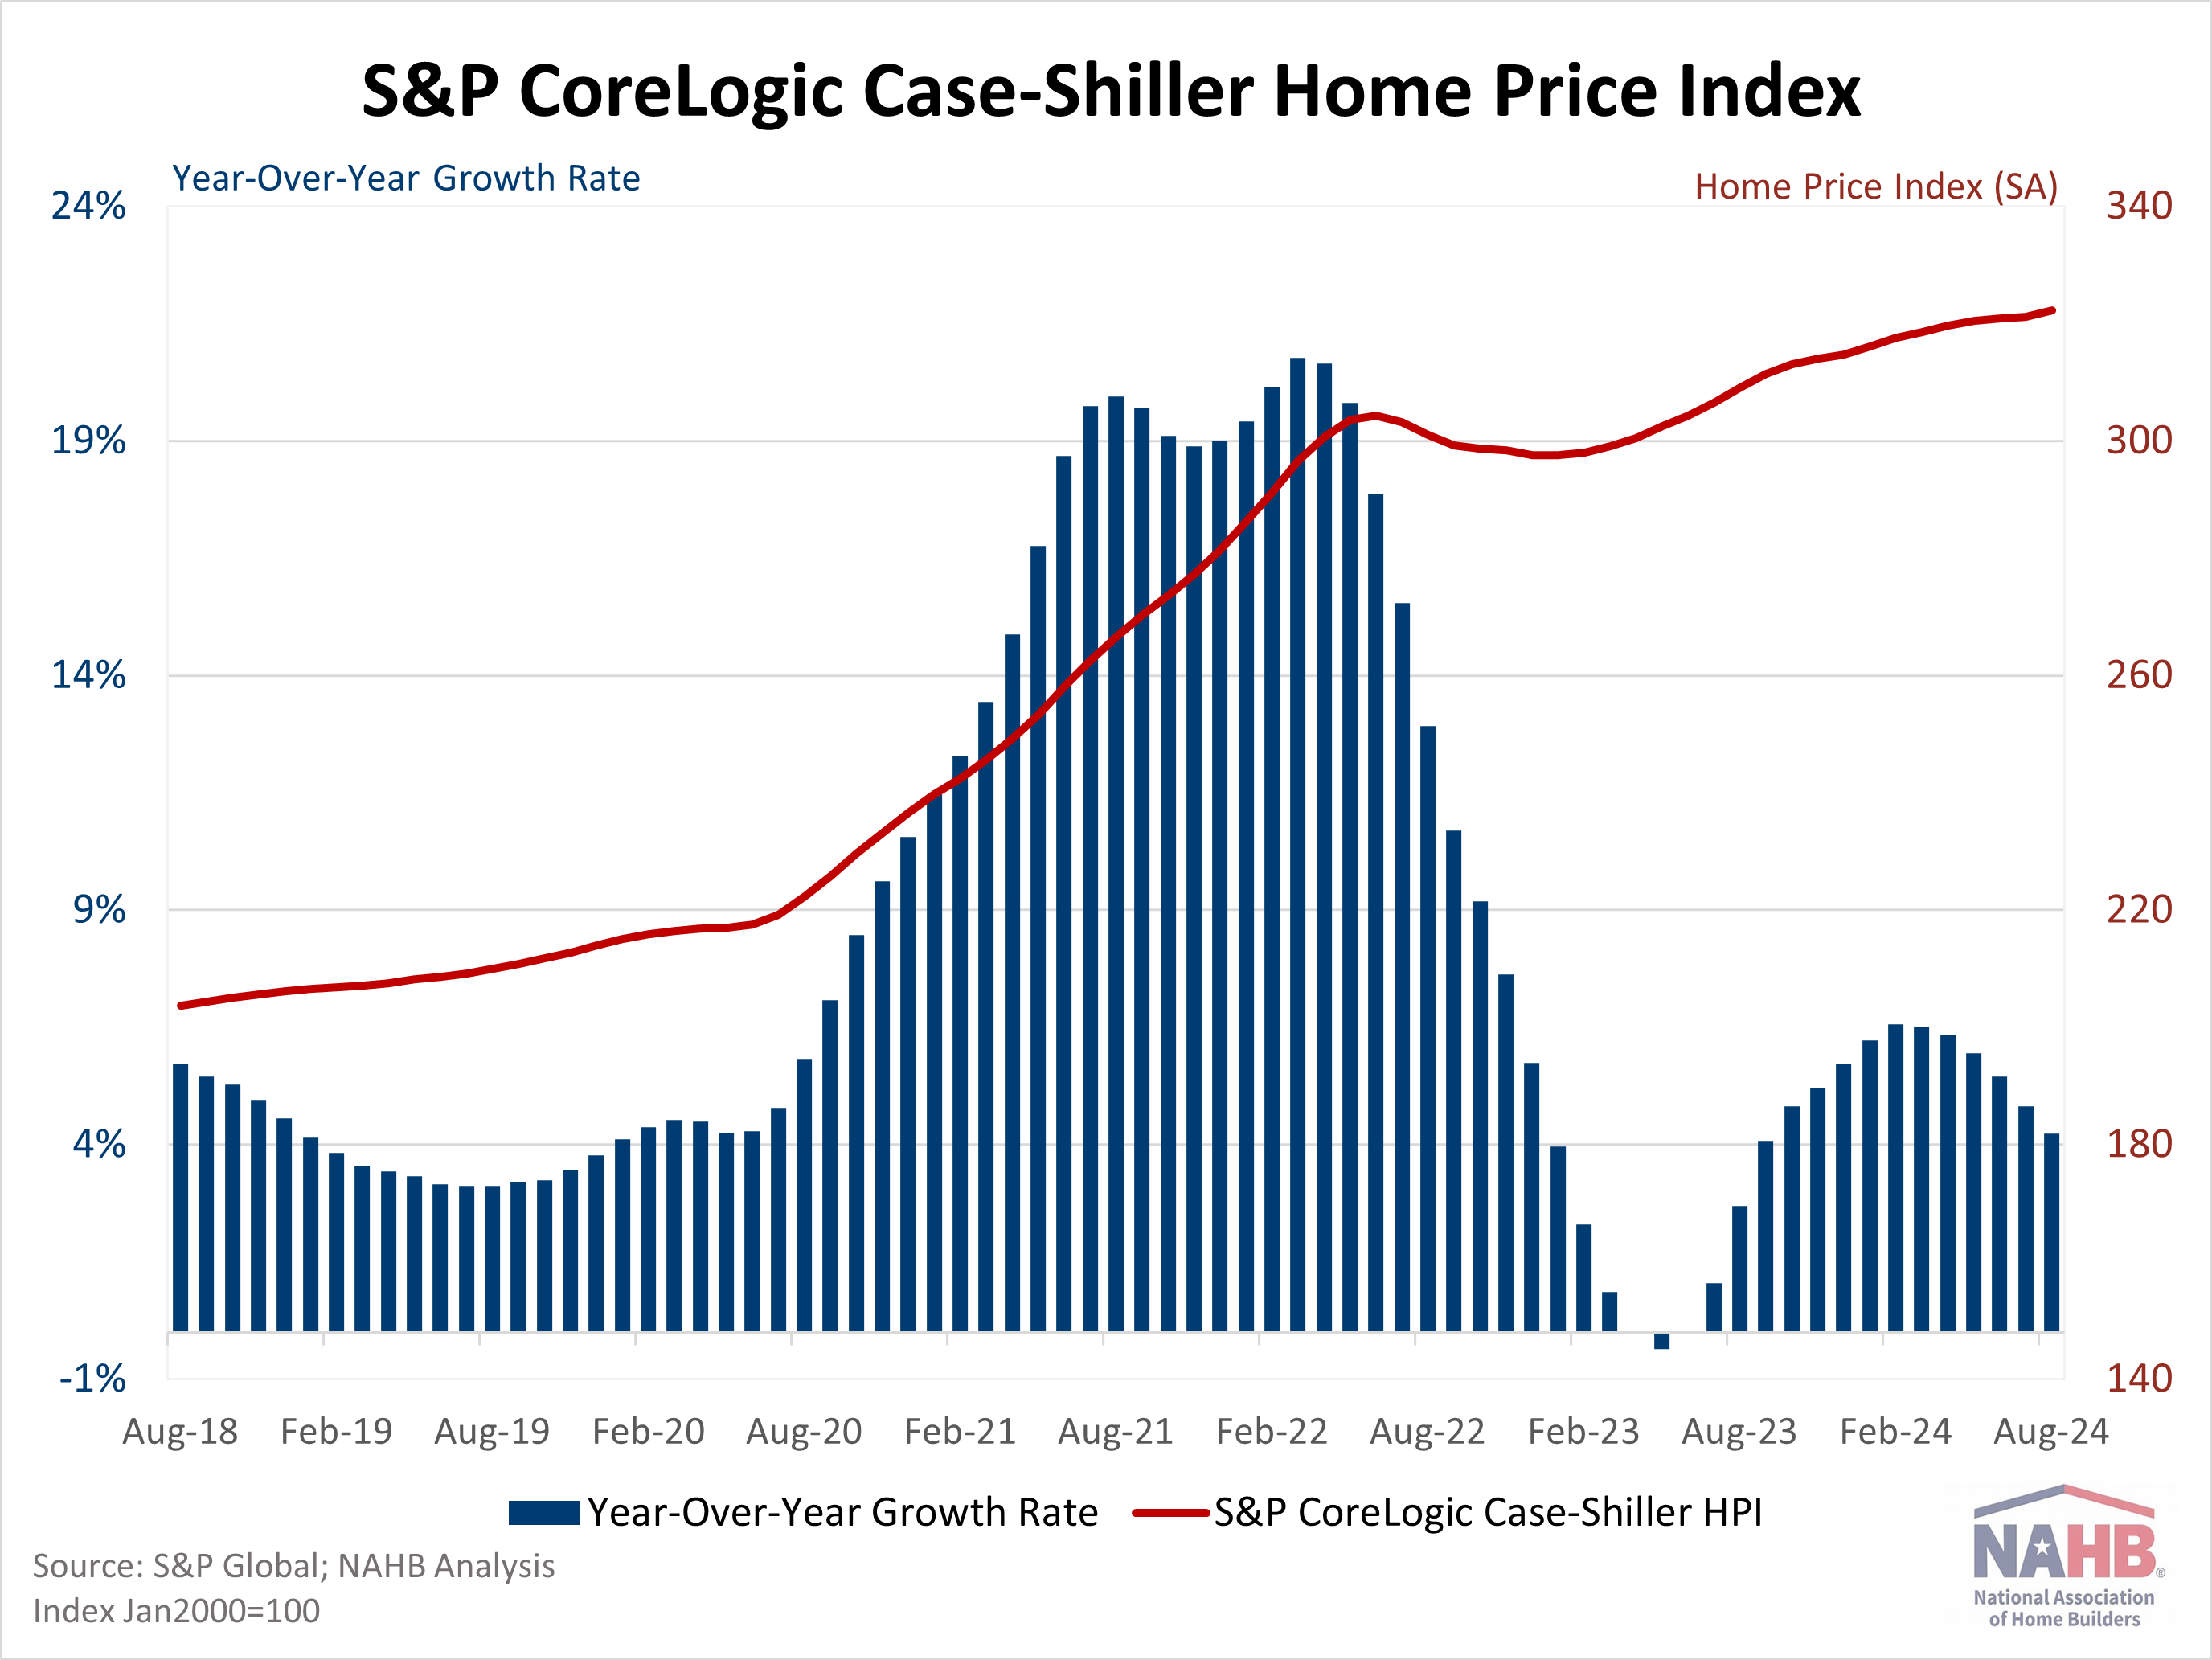
Home price growth continued to slow in August, growing at a rate just above 4% year-over-year, according to analysis from the . The S&P CoreLogic Case-Shiller Home Price Index (seasonally adjusted – SA) posted a 4.24% annual gain, down from a 4.82% increase in July. Similarly, the Federal Housing Finance Agency Home Price Index (SA) rose 4.25%, down from 4.72% in July. Both indexes experienced a sixth consecutive year-over-year deceleration in August. The year-over-year rate peaked in February 2024 when the S&P CoreLogic Case-Shiller stood at 6.57% and the FHFA at 7.28%.

By Metro Area
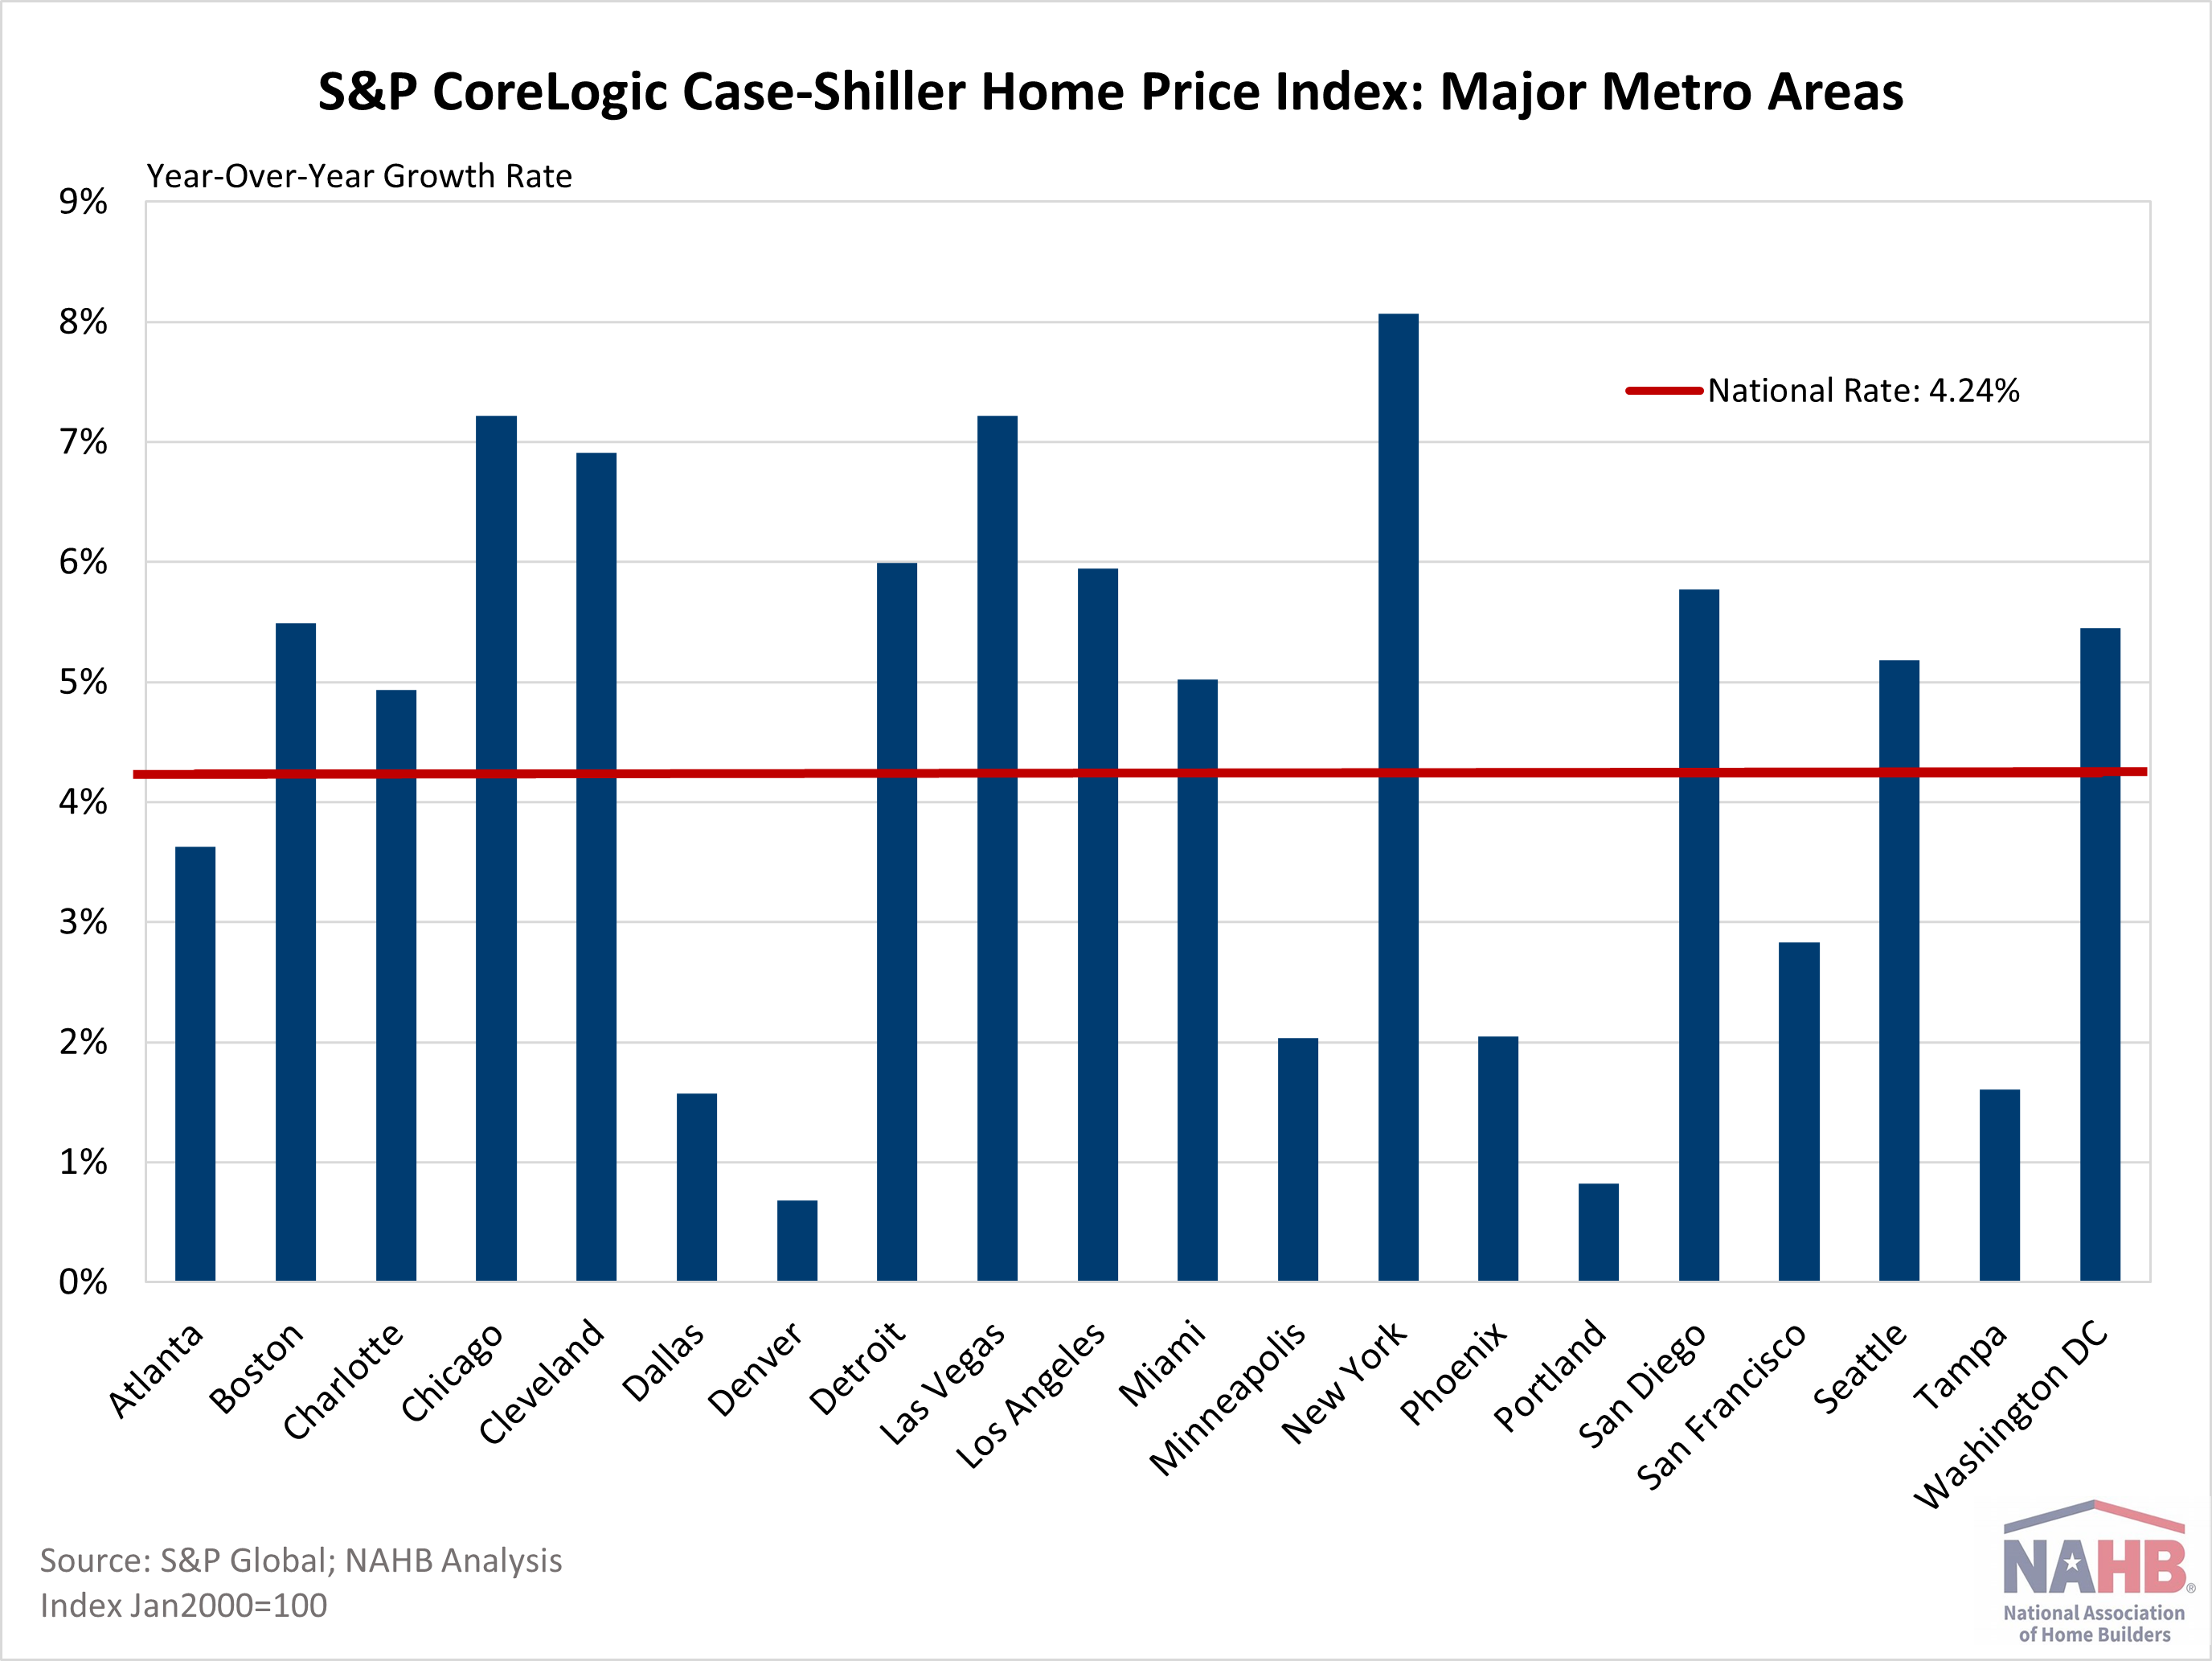
In addition to tracking national home price changes, the S&P CoreLogic Index (SA) also reports home price indexes across major metro areas. Compared to last year, all 20 metro areas reported a home price increase. There were 12 metro areas that grew more than the national rate of 4.24%. The highest annual rate was New York at 8.07%, followed by Las Vegas and Chicago both with rates of 7.22%. The smallest home price growth over the year was seen by Denver at 0.68%, followed by Portland at 0.82%, and Dallas at 1.57%.

By Census Division
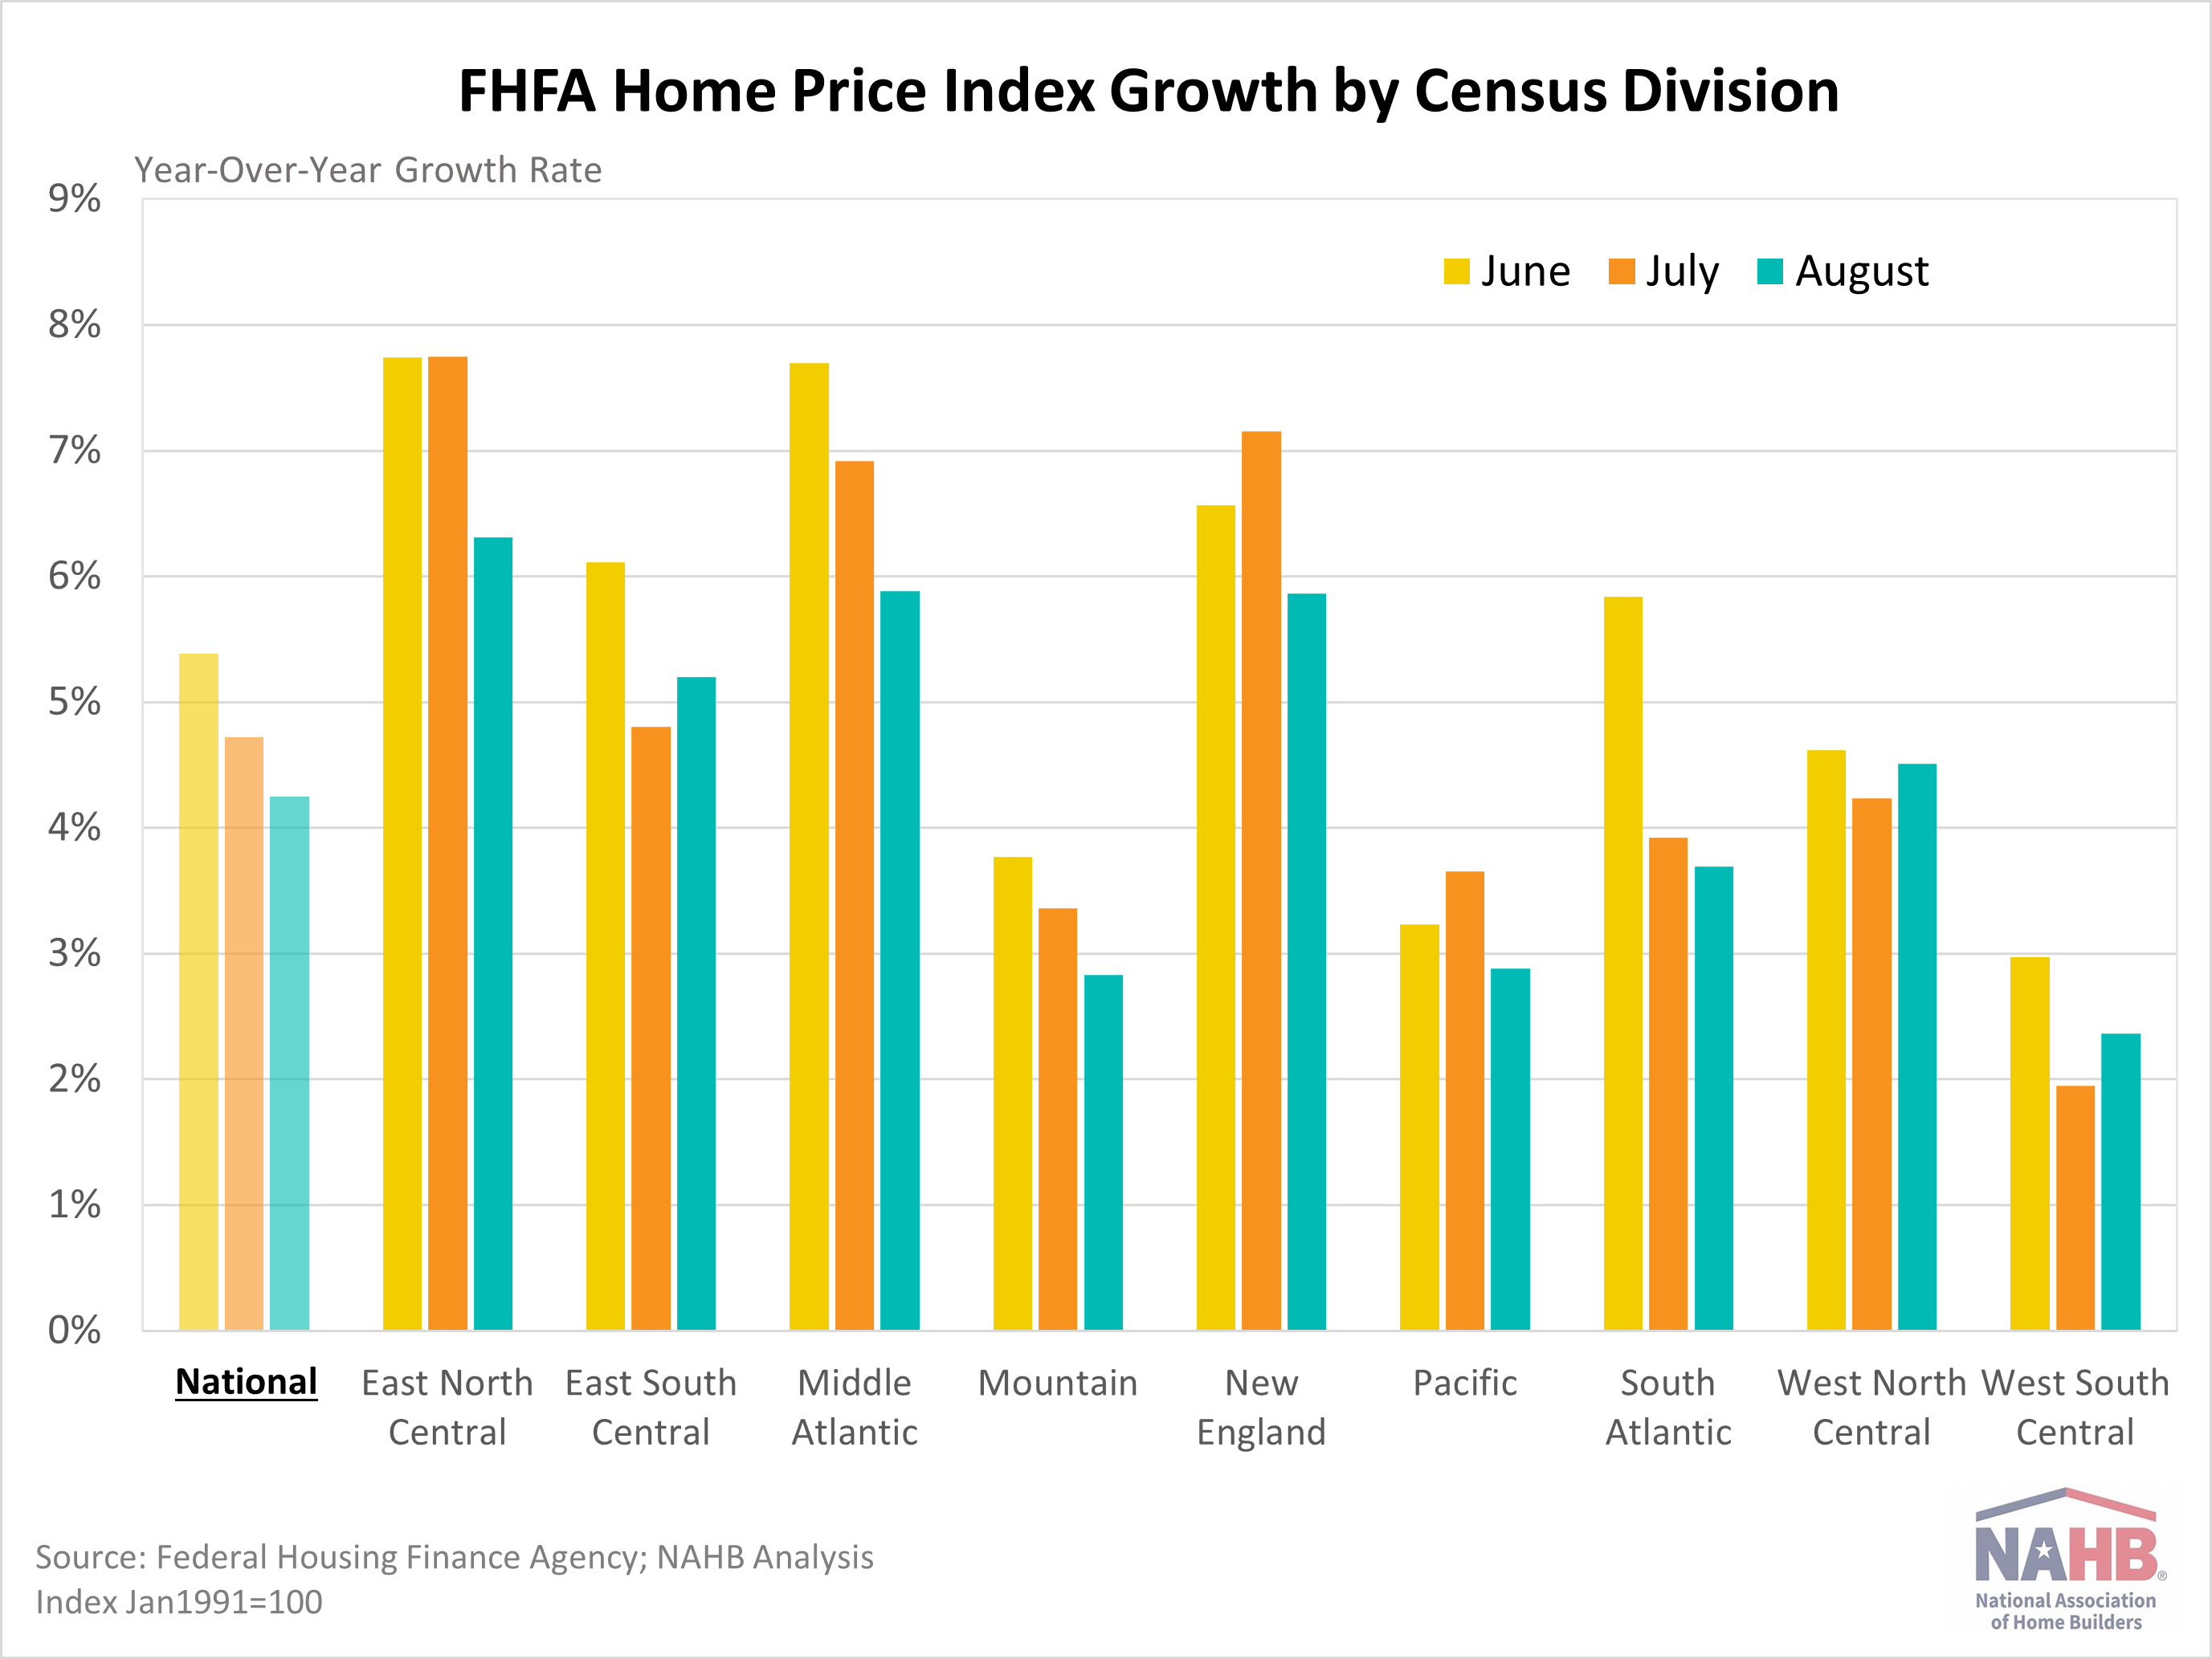
Monthly, the FHFA Home Price Index (SA) publishes not only national data but also data by census division. All divisions saw an annual increase of over 2% in August. The highest rate for August was 6.31% in the East South Central division, while the lowest was 2.36% in the West South Central division. As shown in graph below, all divisions saw a slow in rates compared to June. The FHFA Home Price Index releases their metro and state data on a quarterly basis, which NAHB analyzed in a .


