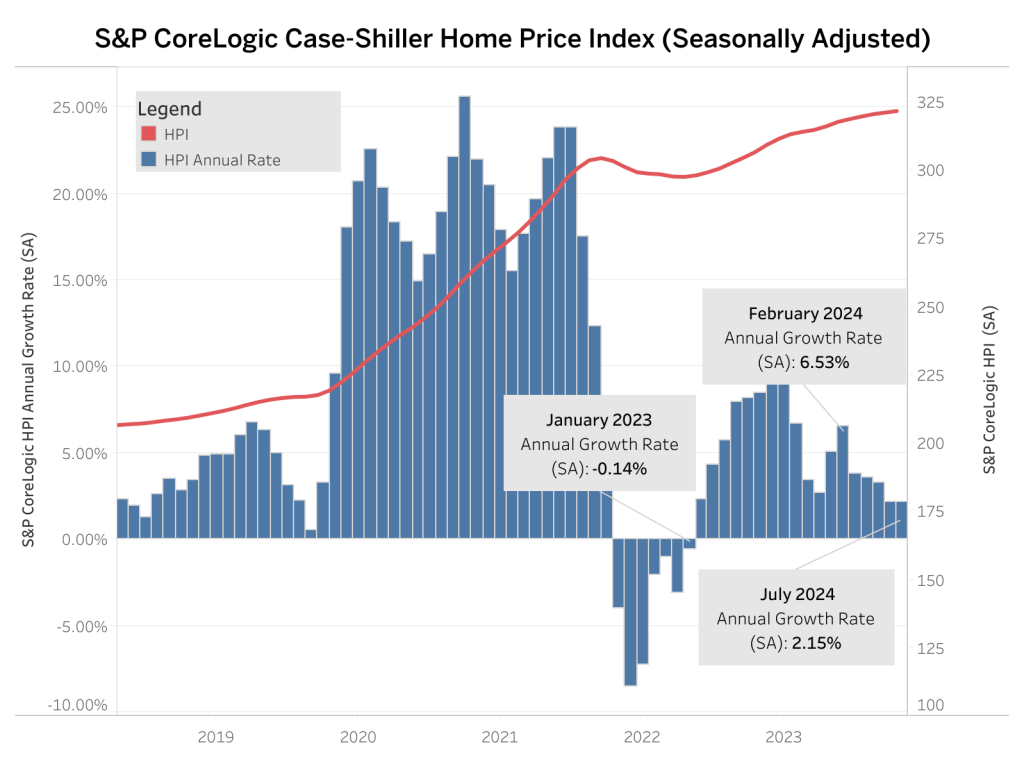
Home prices remain elevated but price growth continues to decelerate, according to the S&P CoreLogic Case-Shiller Home Price Index (HPI) recent . The S&P CoreLogic Case-Shiller HPI (seasonally adjusted) reached its 14th monthly consecutive record high in July 2024. According to analysis from the , the index increased at a seasonally adjusted annual rate of 2.15%, down slightly from a revised June rate of 2.19%. This rate has slowed over the past six months, from a high of 6.53% in February 2024. The index has not seen an outright decrease since January of 2023 (nineteen months).

Separately, the House Price Index by the Federal Housing Finance Agency (FHFA; SA) posted its sixth monthly consecutive record high, after having decreased slightly in January of this year. The FHFA HPI recorded a 1.57% increase in July, upward from a revised 0.03% rate in June.
�۱�-�������-�۱���
Home prices experienced a fifth consecutive year-over-year declaration in July, tabulated by both indexes. The S&P CoreLogic Case-Shiller HPI (not seasonally adjusted – NSA) posted a 4.96% annual gain in July, down from a revised 5.50% increase in June. Meanwhile, the FHFA HPI (NSA) index rose 4.56%, down from a revised 5.37% in June. Both indexes have seen yearly growth rates slow since February 2024, when the S&P CoreLogic Case-Shiller stood at 6.54% and the FHFA at 7.23%.

By Metro Area
In addition to tracking national home price changes, the S&P CoreLogic Index (SA) also reports home price indexes across 20 metro areas. At an annual rate, only two out of 20 metro areas reported a home price decline: San Francisco at -4.98 and Tampa at -3.10%. Among the 20 metro areas, 14 exceeded the national rate of 2.15%. Seattle had the highest rate at 13.78%, followed by New York at 6.11%, and Las Vegas at 5.76%. The monthly trends are shown in the graph below.

Monthly, the FHFA HPI (SA) releases not only national but also census division house price indexes. Out of the nine census divisions, three posted negative monthly depreciation (adjusted to an annual rate) for July: South Atlantic at -7.88%, West South Central at -6.80%, and East South Central at -0.66%. The divisions with positive home price appreciation ranged from 2.02% in West North Central to 11.57% in East South Central. The FHFA HPI releases its metro and state data on a quarterly basis, which NAHB analyzed in a .


